While any amount of snowfall can lead to the creation of something extraordinary, some places have a head start when it comes to snowman-making. To find them, we ranked snowy U.S. cities based on the weather conditions that help snowmen come together, access to classic Frosty supplies, and nearby space where kids can build.
From snow-heavy cities to places with plenty of parks, grocery stores, and room to create, the results show where winter offers the most opportunity to build the perfect snowman.
What makes a city great for snowmen?
When considering the most ideal places in the U.S. for a new snowman, it’s important to know a few things. A snowman needs more than one lucky day of snow. Cities with more snow days, heavier annual snowfall, and plenty of days with snow already on the ground give kids more chances to get rolling. We also looked at days with temperatures that are cold enough to help a snowman keep its shape, because no one wants to spend an hour on the world’s best snow creature only to watch it turn into a puddle.
Of course, even the snowiest city needs a few finishing touches. A proper Frosty needs a carrot nose, coal eyes, an old hat, something cozy around the neck, and a pair of stick arms. Cities with more grocery stores, hardware stores, thrift stores, and tree canopy coverage performed better in our ranking because they could make it easier to gather the essentials.
Finally, we considered where kids might have room to bring their creations to life. Cities with more young residents, a higher share of detached homes (providing a higher likelihood of having a yard), and easy access to parks earned points for offering more places to build, experiment, and start a neighborhood snowman scene. With those snowy, supply-filled, and kid-friendly ingredients in mind, we found the cities where snowman-making has the strongest chance of becoming a winter tradition.
“Building a snowman is one of those simple activities that can turn into an adventure,” said Julie Walling, Senior Director of Marketing at KiwiCo. “When kids are building a snowman, they're using materials creatively, solving little problems, and bringing a character to life. That whole process encourages imagination.”
Which U.S. cities are best for building a snowman?
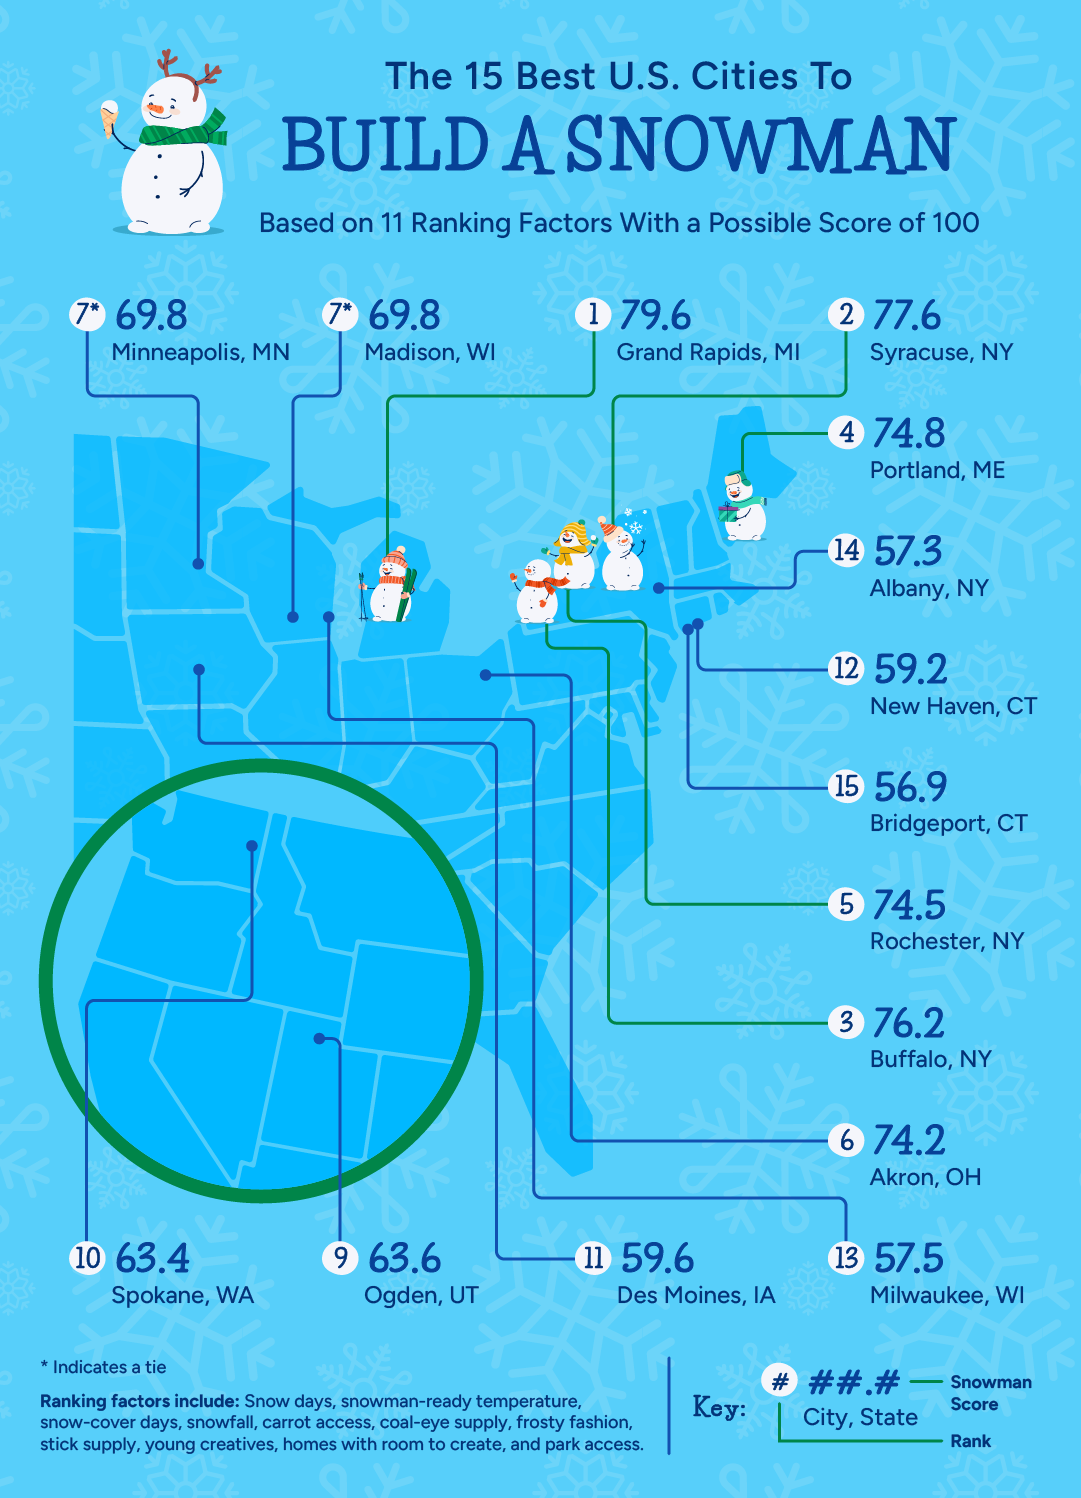
A great snowman needs more than a fresh layer of powder. It needs the right kind of snow, weather that helps it hold its shape, a few key accessories, and enough room to create.
When you look at the data, some cities make all of that a little bit easier than others. Here are the 5 places that rose to the top of our ranking for snowman-building success.
The five best cities to build a snowman
These cities sit in parts of the country where snowy winters are part of the seasonal rhythm. When the flakes start falling, it’s a good excuse to pull on the warmest mittens, head outside, and see what a few snowballs can become.
Grand Rapids, Michigan — 79.6
Syracuse, New York — 77.6
Buffalo, New York — 76.2
Portland, Maine — 74.8
Rochester, New York — 74.5
Grand Rapids came out on top with a well-rounded mix of wintry weather, supplies, and room to create. The city averages 19 snow days and nearly 66 inches of annual snowfall, along with almost 29 days each year when high temperatures stay between 23 and 32 degrees—the sweet spot for snow that’s easier to pack and sculpt. Its tree canopy coverage is also among the study’s highest at 34.7%, which will come in handy when it’s time to find sticks for Frosty’s arms.
One major theme in the top five is regionality. It seems that the Empire State is a snowman’s paradise. Syracuse led the study in average annual snowfall with nearly 98 inches, while Buffalo was close behind at nearly 87 inches and had the highest grocery-store density among the top cities. Rochester brought 23 snow days, nearly 83 inches of annual snowfall, and easy park access for 90% of residents.
Portland, finishing fourth in the ranking, stood out for snow-cover days, as well as hardware store, thrift store, and park access, giving families a strong mix of snowy conditions and snowman-worthy finishing touches.
Snowman-building strongholds in the Midwest and West
At this point in the ranking, the map starts to spread out. The Midwest claims three of these five spots, while Ogden and Spokane show that snowman-building potential stretches from the Great Lakes to the inland West.
Akron, Ohio — 74.2
Madison, Wisconsin — 69.8
Minneapolis, Minnesota — 69.8
Ogden, Utah — 63.6
Spokane, Washington — 63.4
Akron nearly matched the top five thanks to its balance of snow, space, and snowman-ready temperatures. It led the study with an average of 42.9 days each year when the daily high falls between 23 and 32 degrees. Madison and Minneapolis also brought plenty of snow-building potential, with 31.8 and 34.5 ideal-temperature days, respectively. Minneapolis led all cities for snow-cover days, averaging more than 60 days each year with at least 2 inches of snow on the ground.
Ogden excelled when it came to providing people with ample space to create. It had the study’s second-highest share of residents of prime snowman-building age (5 to 17) and the second-highest detached-home share (meaning plenty of yards to start rolling snowballs). Spokane combined a solid 86% park-access rate with a high number of thrift stores per capita for snowman wardrobe inspiration.
More cities made for snowy afternoons
The final 5 cities span the Midwest and Northeast, two regions where winter weather invites kids outside to make the most of a snowy afternoon.
Des Moines, Iowa — 59.6
New Haven, Connecticut — 59.2
Milwaukee, Wisconsin — 57.5
Albany, New York — 57.3
Bridgeport, Connecticut — 56.9
The next five cities show that a snowman-friendly day can come together in more than one way. Des Moines had the highest share of young residents in the study, while New Haven and Milwaukee each offered easy park access for 96% of residents. Albany paired nearly 47 inches of average annual snowfall with strong grocery-store access, and Bridgeport combined more than 56 inches of snow with plenty of nearby parks.
Whether the finished product stands in a backyard or a neighborhood park, every great snowman starts with the right ingredients: snow, accessories, and space to build. Next, we’re digging into the individual factors that helped certain cities shine.
The best cities for snow days and snowman supplies
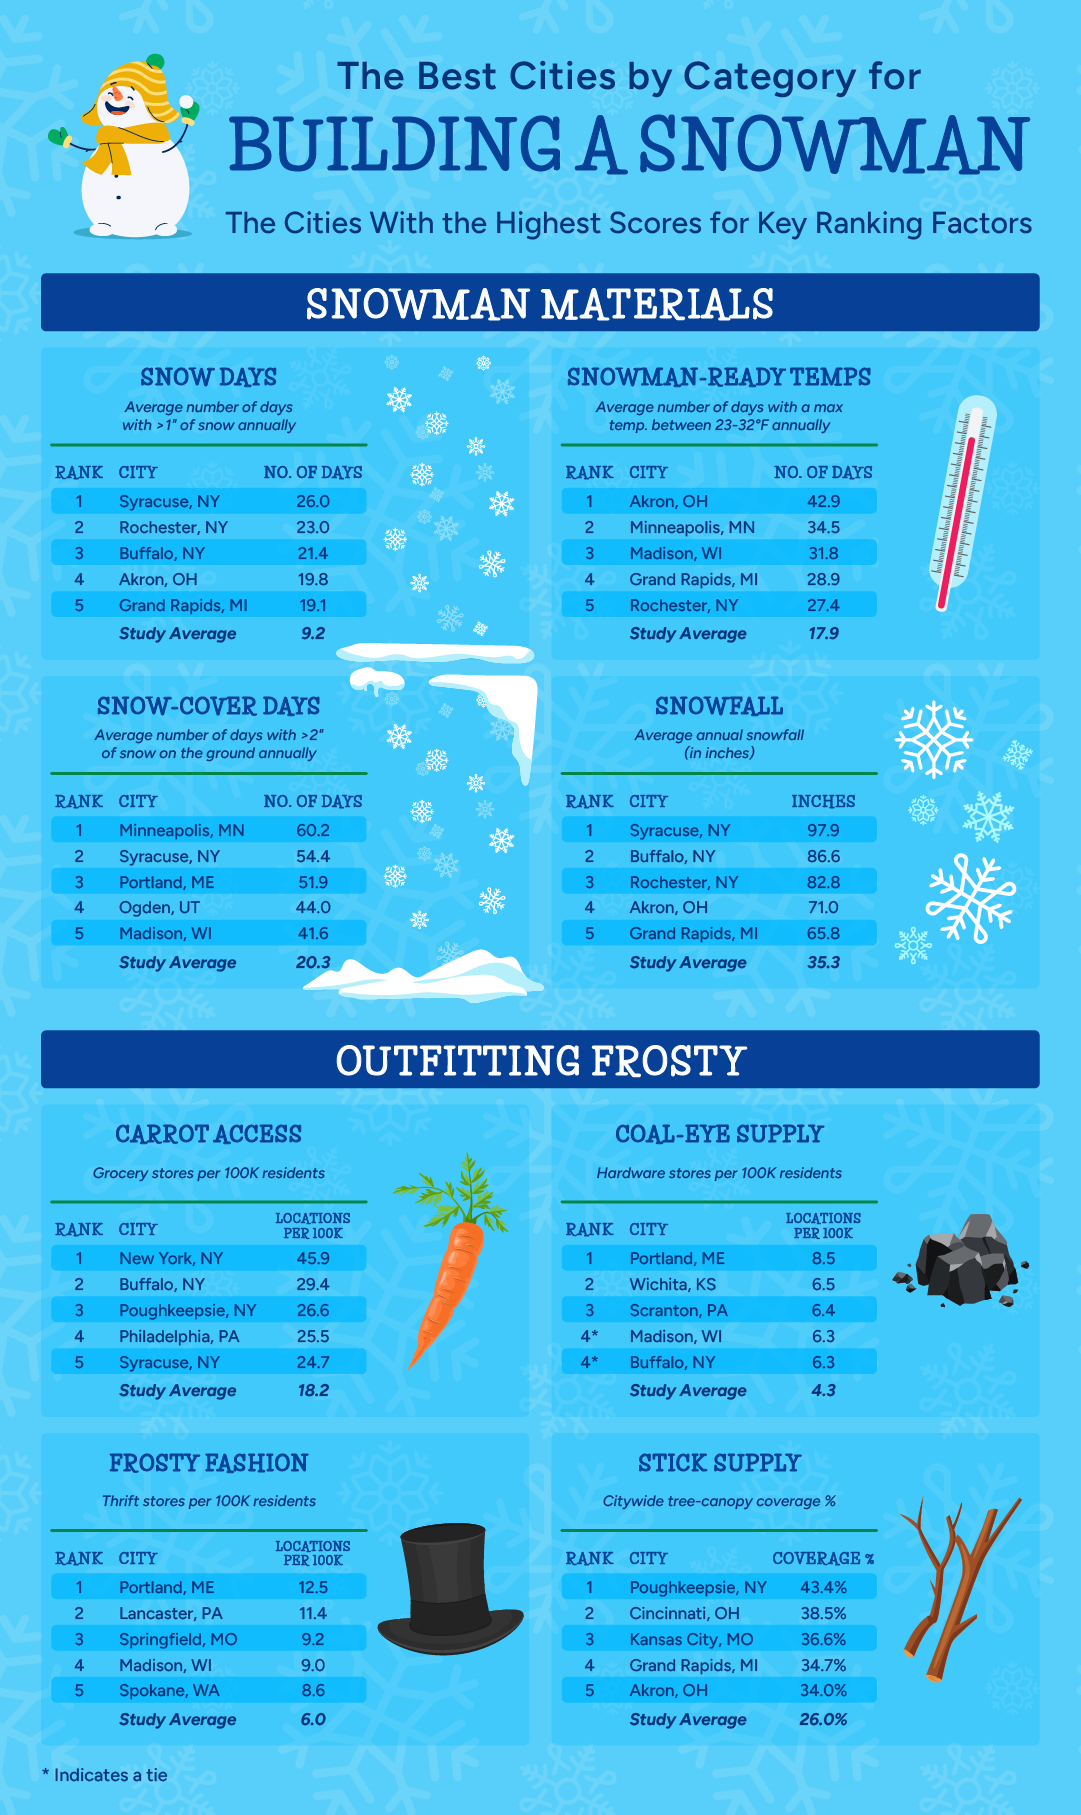
The overall ranking tells one part of the story. But a closer look at the individual factors reveals which cities stand out for the snowy building blocks, Frosty’s finishing touches, and places where kids have room to create.
Snow and staying power
Fresh snow is a fine start, but more opportunities to build—and weather that helps a snowman stay standing—can make a winter day outside even more fun.
Syracuse led for both snow days and snowfall. It averages 26 days with more than an inch of snow and nearly 98 inches of snowfall each year.
New York’s snowy cities keep showing up near the top. Rochester and Buffalo followed Syracuse for snow days, and placed second and third for annual snowfall, respectively.
Akron had the most snowman-ready temperature days. It averages nearly 43 days each year with high temperatures between 23 and 32 degrees.
Minneapolis led for snow-cover days. The city averages more than 60 days annually with at least 2 inches of snow on the ground.
From familiar New York cities to the Great Lakes, there are plenty of places where a snow day can turn into a snowman day more than once each winter.
Frosty’s finishing touches
Without some finishing touches, like a corncob pipe and button nose, for example, a snowman is no more than just a glorified snow mound. It needs a personality in the form of carrots, sticks, and winter gear to stand up to the harsh weather. We looked at grocery store, hardware stores, and thrift store access as proxies for snowman supplies, as well as tree canopy coverage for stick-arm potential.
New York City led for grocery-store access with 45.9 locations per 100K residents. Buffalo, Poughkeepsie, Philadelphia, and Syracuse followed.
Portland topped the list for both hardware-store and thrift-store access. It had 8.5 hardware stores and 12.5 thrift stores per 100K residents.
Madison was another strong all-around supply city, placing among the top five for both hardware stores and thrift stores.
Poughkeepsie led for tree canopy coverage at 43.4%, followed by Cincinnati, Kansas City, Grand Rapids, and Akron.
Portland’s high supply-store access helps explain its strong overall showing. Meanwhile, Buffalo and Syracuse pair snow-heavy winters with high grocery-store access, making it a little easier to pick up the classic carrot-nose before heading outside. And in places like Poughkeepsie and Grand Rapids, higher tree canopy coverage means more sticks laying around for makers to add some liveliness to their snowy creations.
Room to build and play
A nearby park, an open neighborhood space, or a front yard can all become a building zone when the snow is right.
Utah cities led for the share of residents ages 5 to 17. Provo ranked first at 22.3%, followed by Ogden at 21.1% and Salt Lake City at 18.5%.
Boise, Idaho had the highest detached-home share at 76.3%, followed by Ogden at 74.3% and Springfield, Missouri, at 73.7%.
Boston led for park access, with 100% of residents living within a 10-minute walk of a park. Minneapolis, Providence, and New York followed closely, each with 99% of residents having easy park access.
Utah’s strong showing for young residents and detached homes suggests plenty of opportunities for kids to find fellow builders and space to spread out. On the other hand, cities with standout park access show that snowman-making doesn’t need to stay at home. When a local green space turns white, it can become the perfect canvas.
Whether a city excels in snowfall, supplies, or space to build, the same idea holds true: winter weather can give kids a fresh reason to make, experiment, and play outside.
A city guide to snowman-building
Interested in how your city stacks up when it comes to crafting, outfitting, and playing with a snowman? We’ve broken down our full data for the 50 cities we analyzed for you to find out. Search for cities directly, sort by each column heading individually, or sift through the full data set yourself below.
A snow day is a chance to create
No matter where you live, a great snowman starts with a little imagination. Our study highlights the cities with the strongest mix of snowman-necessary ingredients, but every fresh snowfall can be a chance to create something new.
A snow day is an invitation to experiment, problem-solve, and see what happens when a few snowballs, sticks, and a carrot come together. It might be a classic Frosty, a snow dinosaur, or a whole crew of tiny snow creatures.
KiwiCo believes hands-on making can spark big ideas, whether kids are building outside in the snow or creating around the kitchen table. So bundle up, gather your materials, and let the next snow day inspire a project of your own.
You can always keep the creativity going with hands-on winter projects, find gifts for the curious kid in your life, or explore more projects the creators in your life will love.
Methodology
To determine the best U.S. cities to build a snowman, we evaluated 50 large U.S. cities that tend to get at least 10" of snow per year on 11 different ranking factors that would impact one's ability to create a snowman.
The factors were weighted based on their importance to snowman creation. Based on these weights, the individual factors were given scores from 0 to 5 and summed to reach a total score of 0 to 100 with 100 representing the most ideal conditions.
The full list of factors considered, their weights, and sources is here:
| Ranking Factor | Source | Weight |
| Snow Days | NOAA | 2.50 |
| Snowman-ready temperature | NOAA | 2.50 |
| Snow-cover days | NOAA | 2.50 |
| Snowfall | NOAA | 2.50 |
| Carrot access | Census | 1.50 |
| Coal-eye supply | Census | 1.50 |
| Frosty fashion | Census | 1.50 |
| Stick supply | Tree Equity Score | 1.50 |
| Young creatives | Census | 2.00 |
| Homes with room to create | Census | 1.00 |
| Park access | Trust for Public Land | 1.00 |
Data Usage Guidelines
This data is available for public use; we just ask that you cite KiwiCo and link to this page for your initial reference of it. For example:
- According to recent research from KiwiCo, a company that creates hands-on learning projects designed to inspire curiosity, creativity, and problem-solving in kids.
- Data is provided by KiwiCo, a maker of hands-on learning crates for kids.