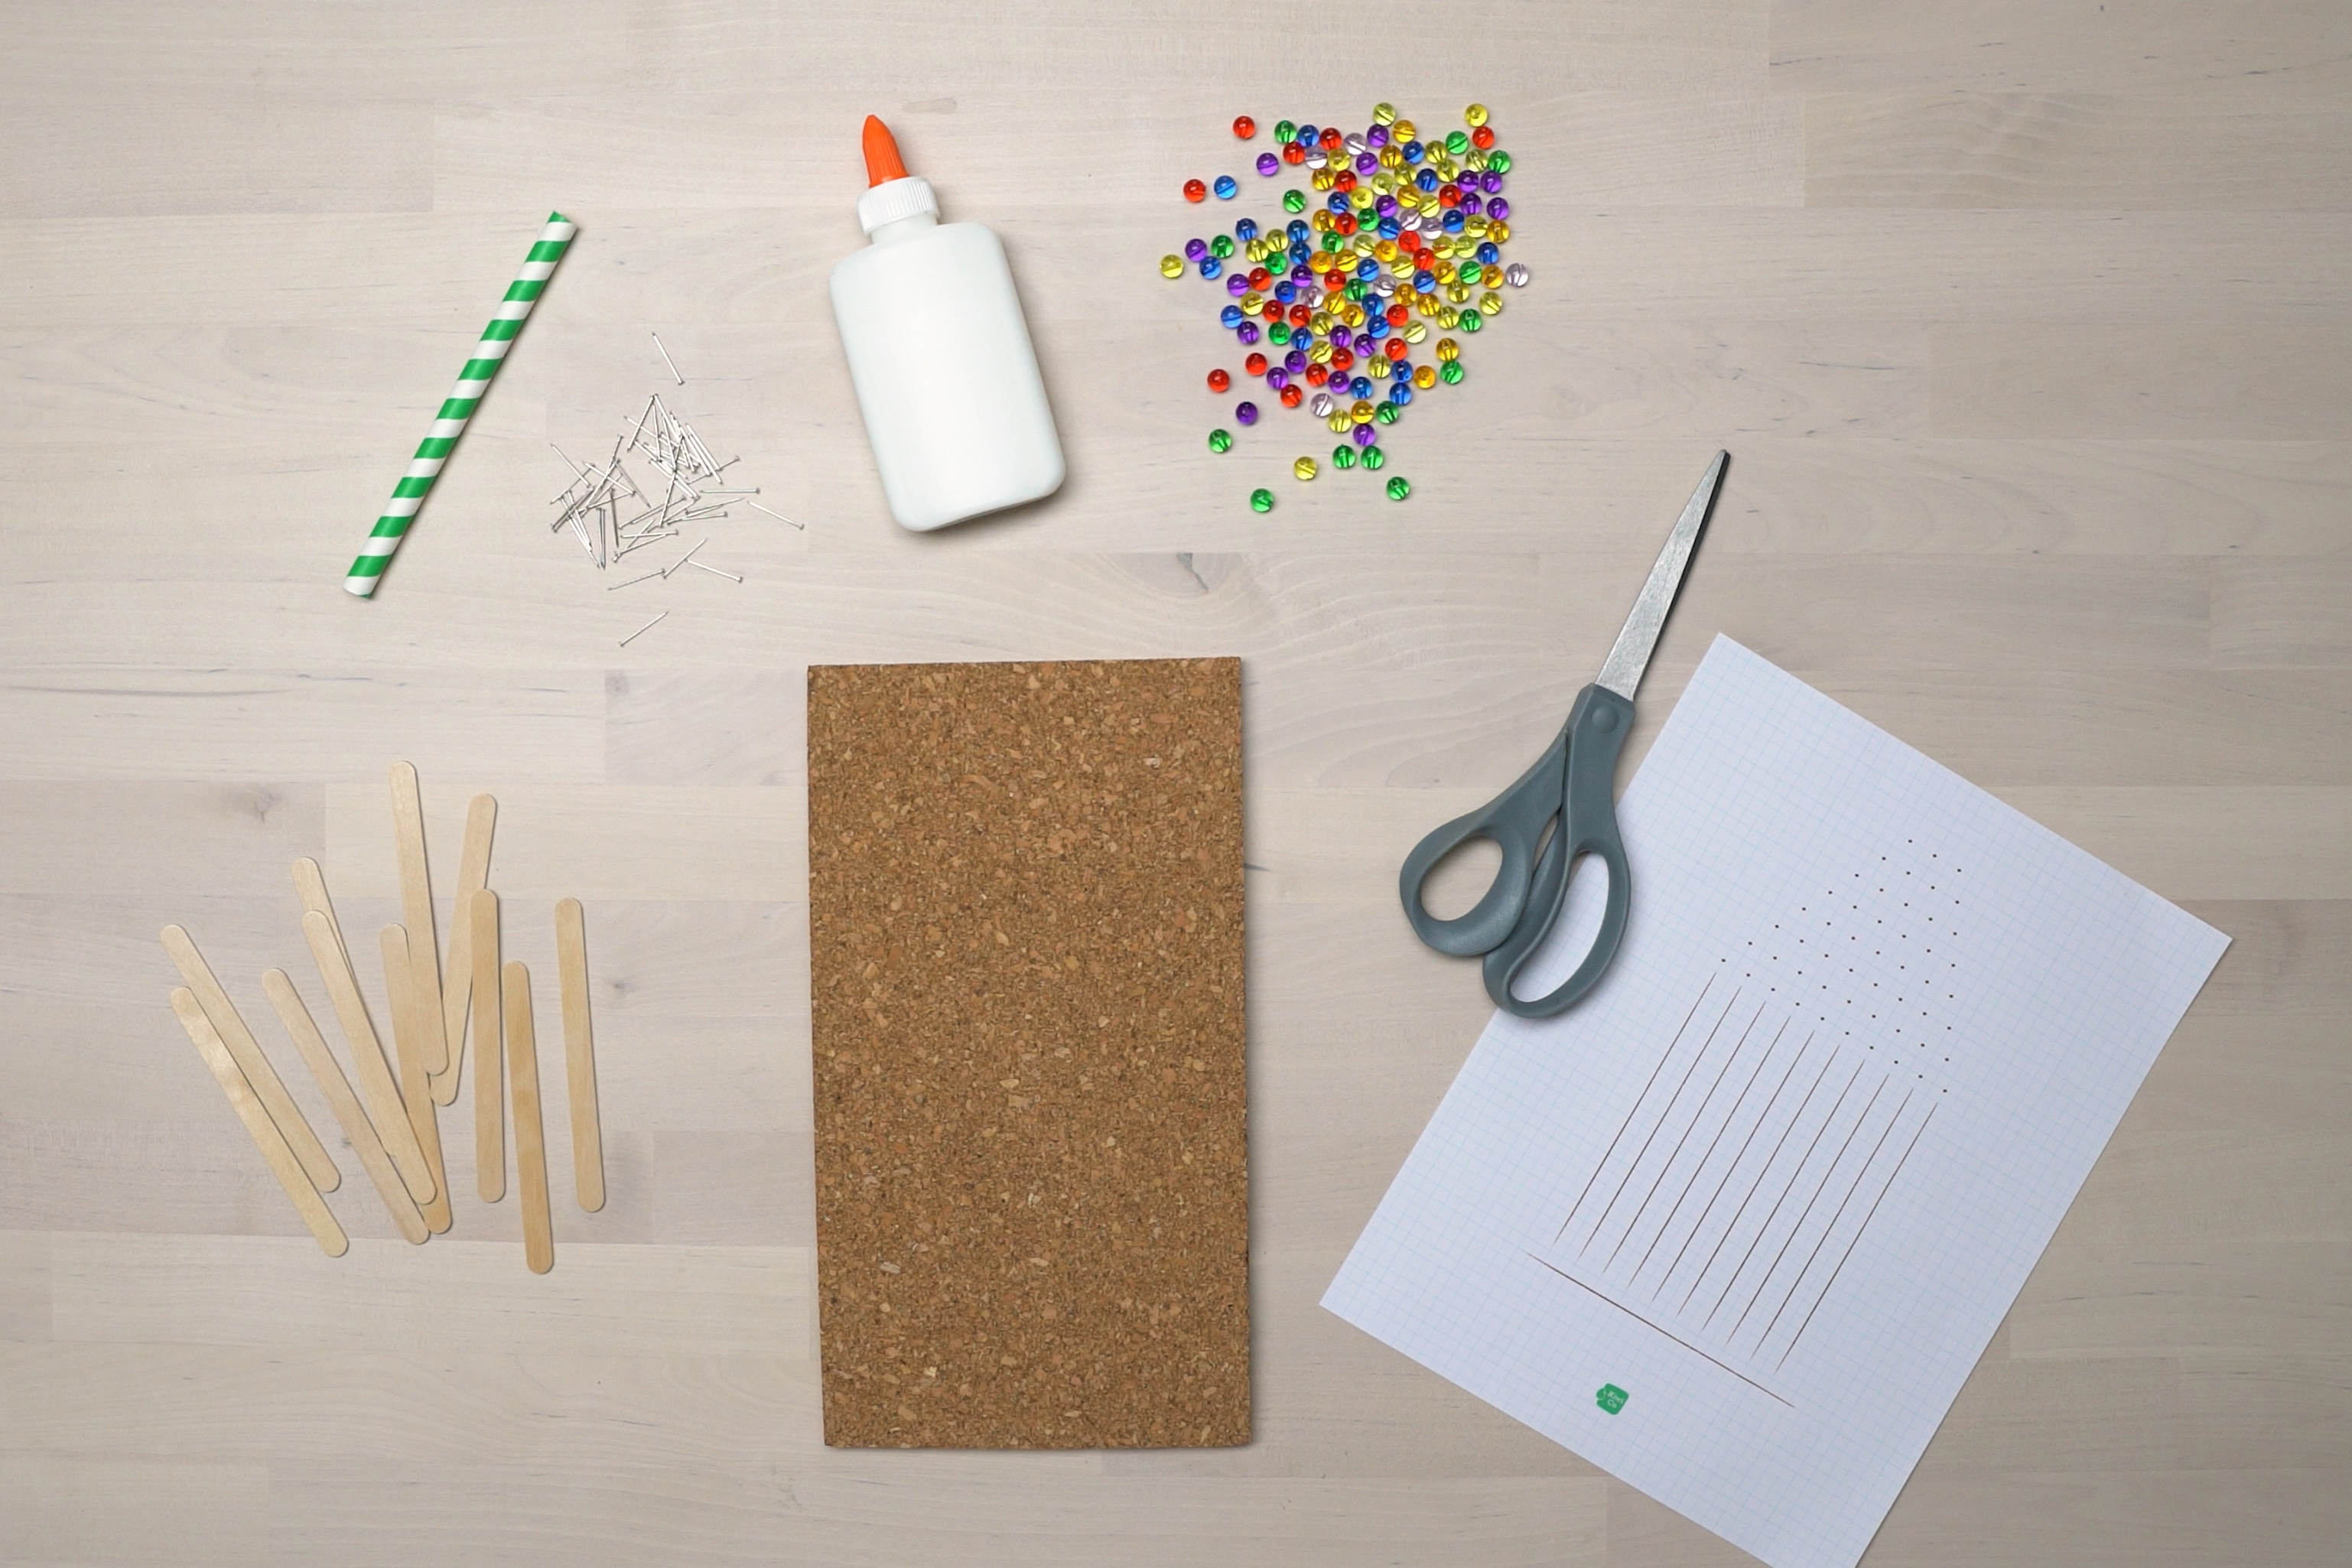
Step-by-step tutorial
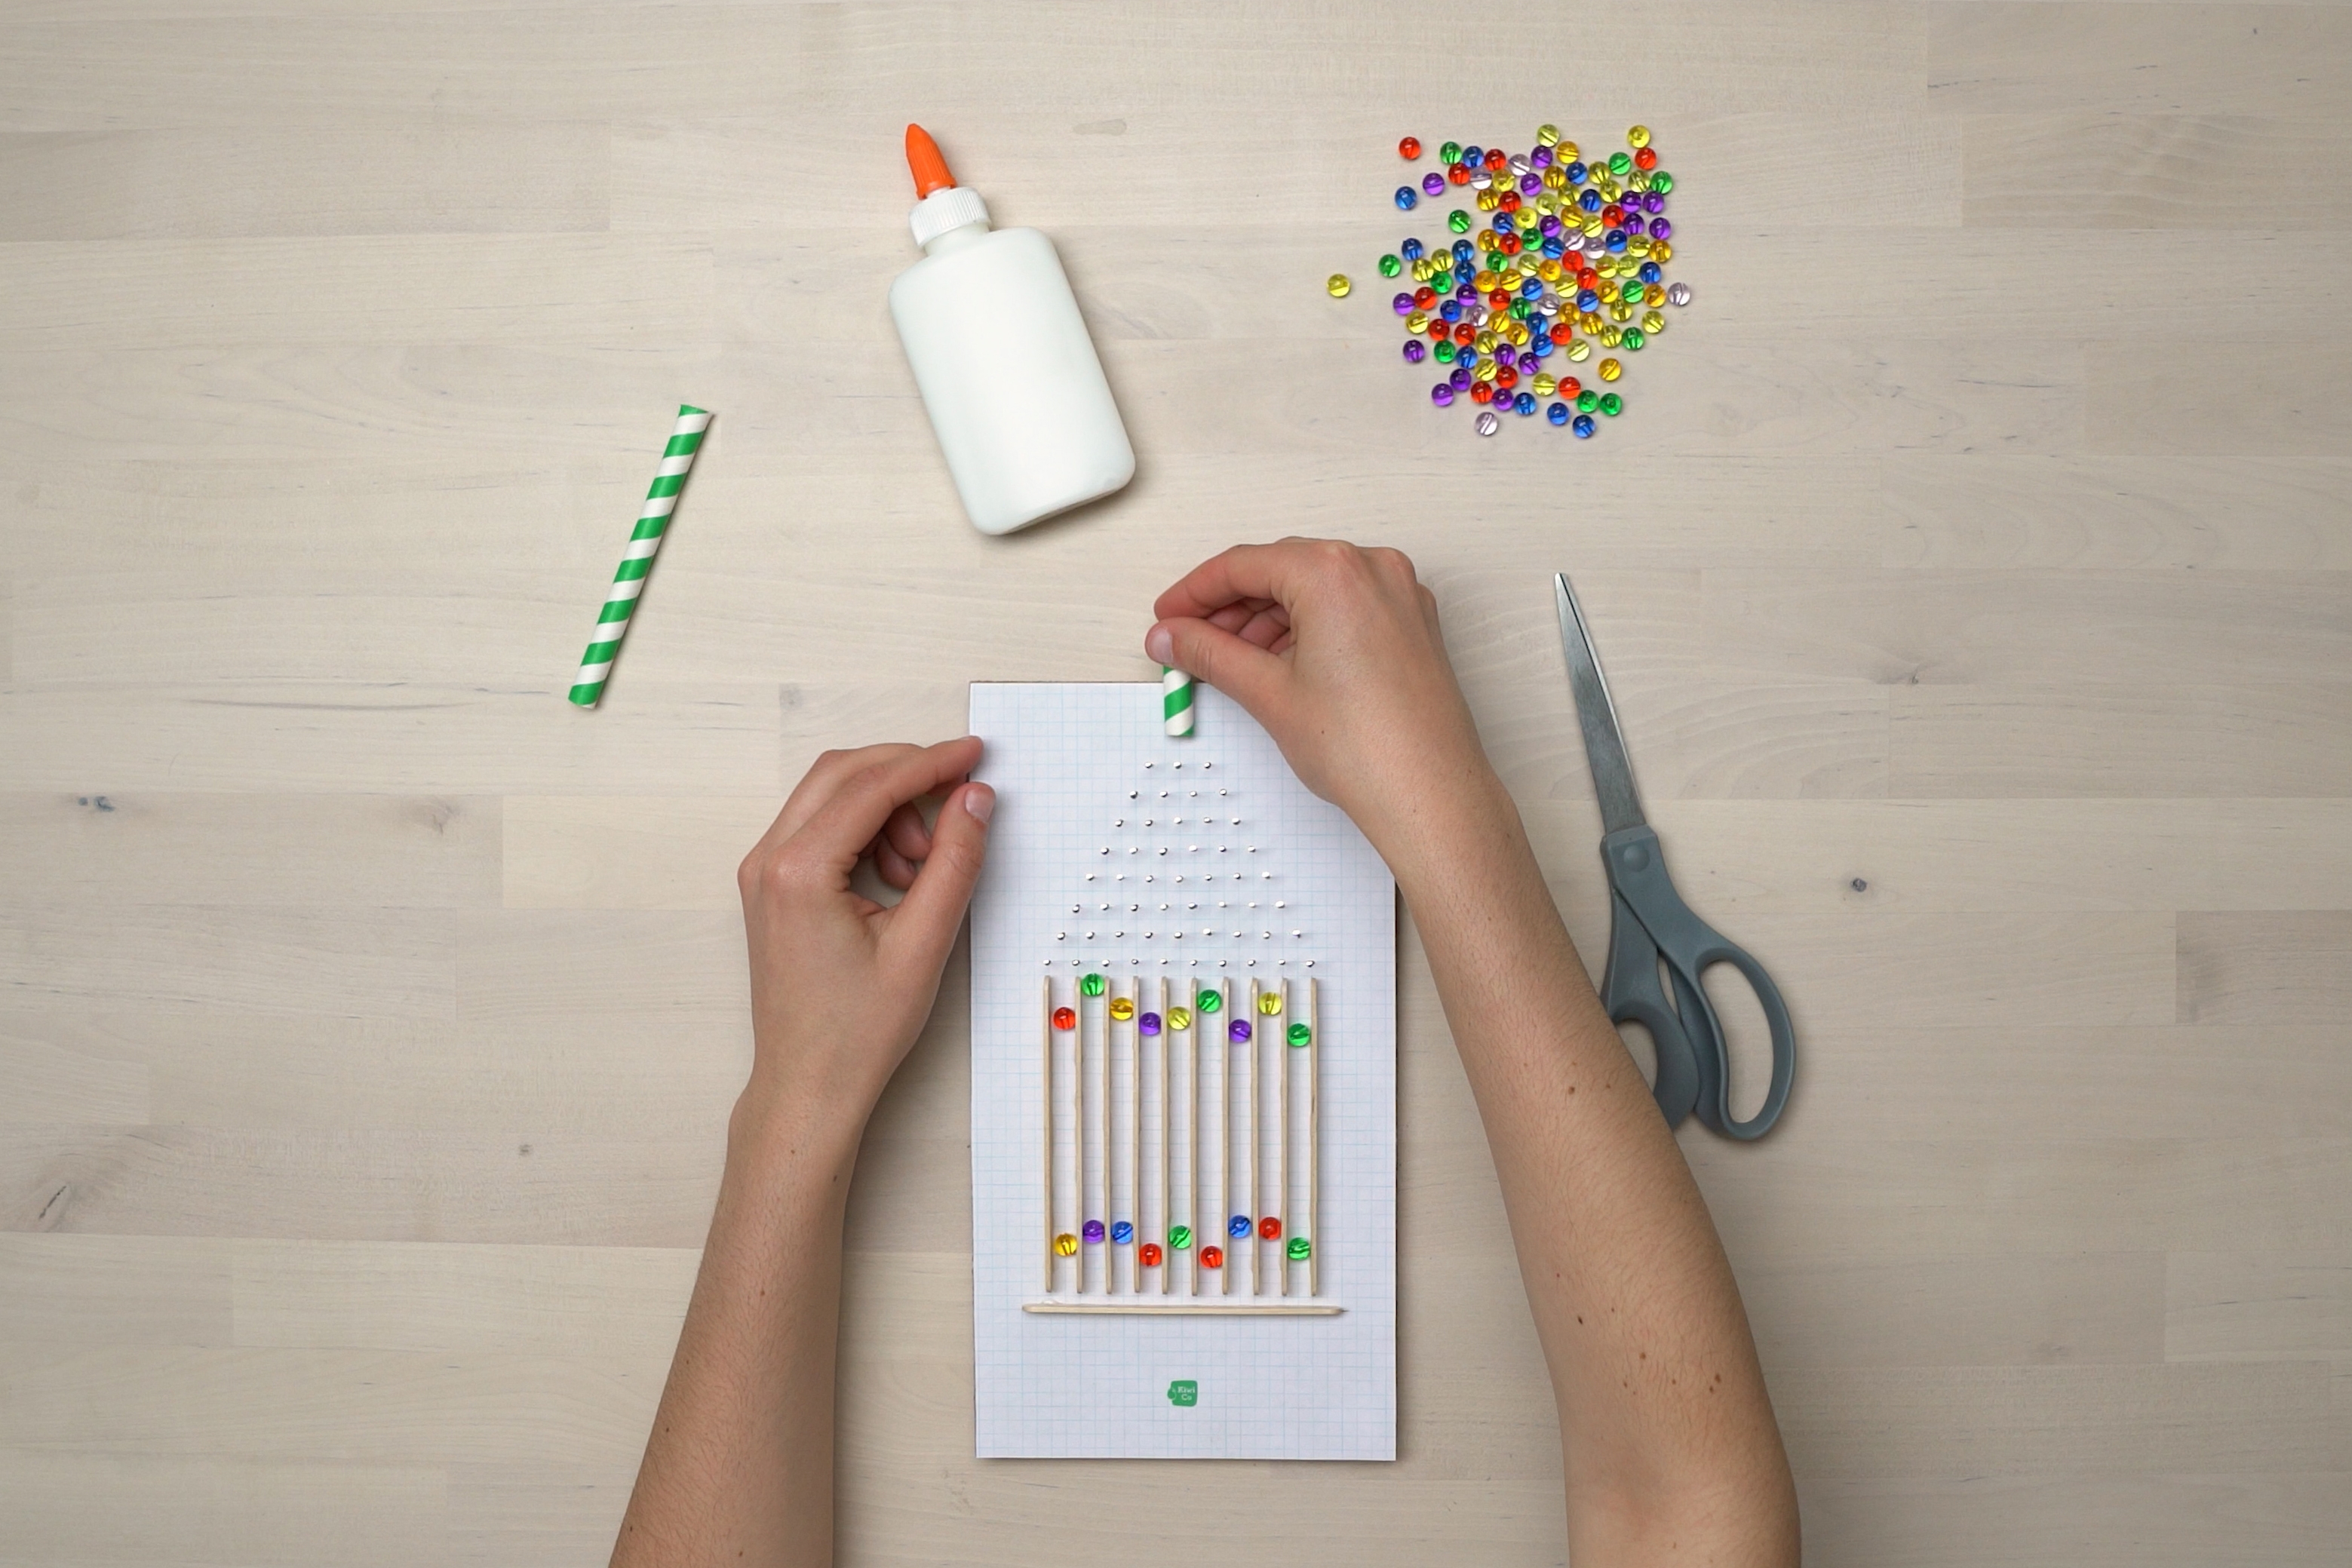
Step 1
Gather your materials.

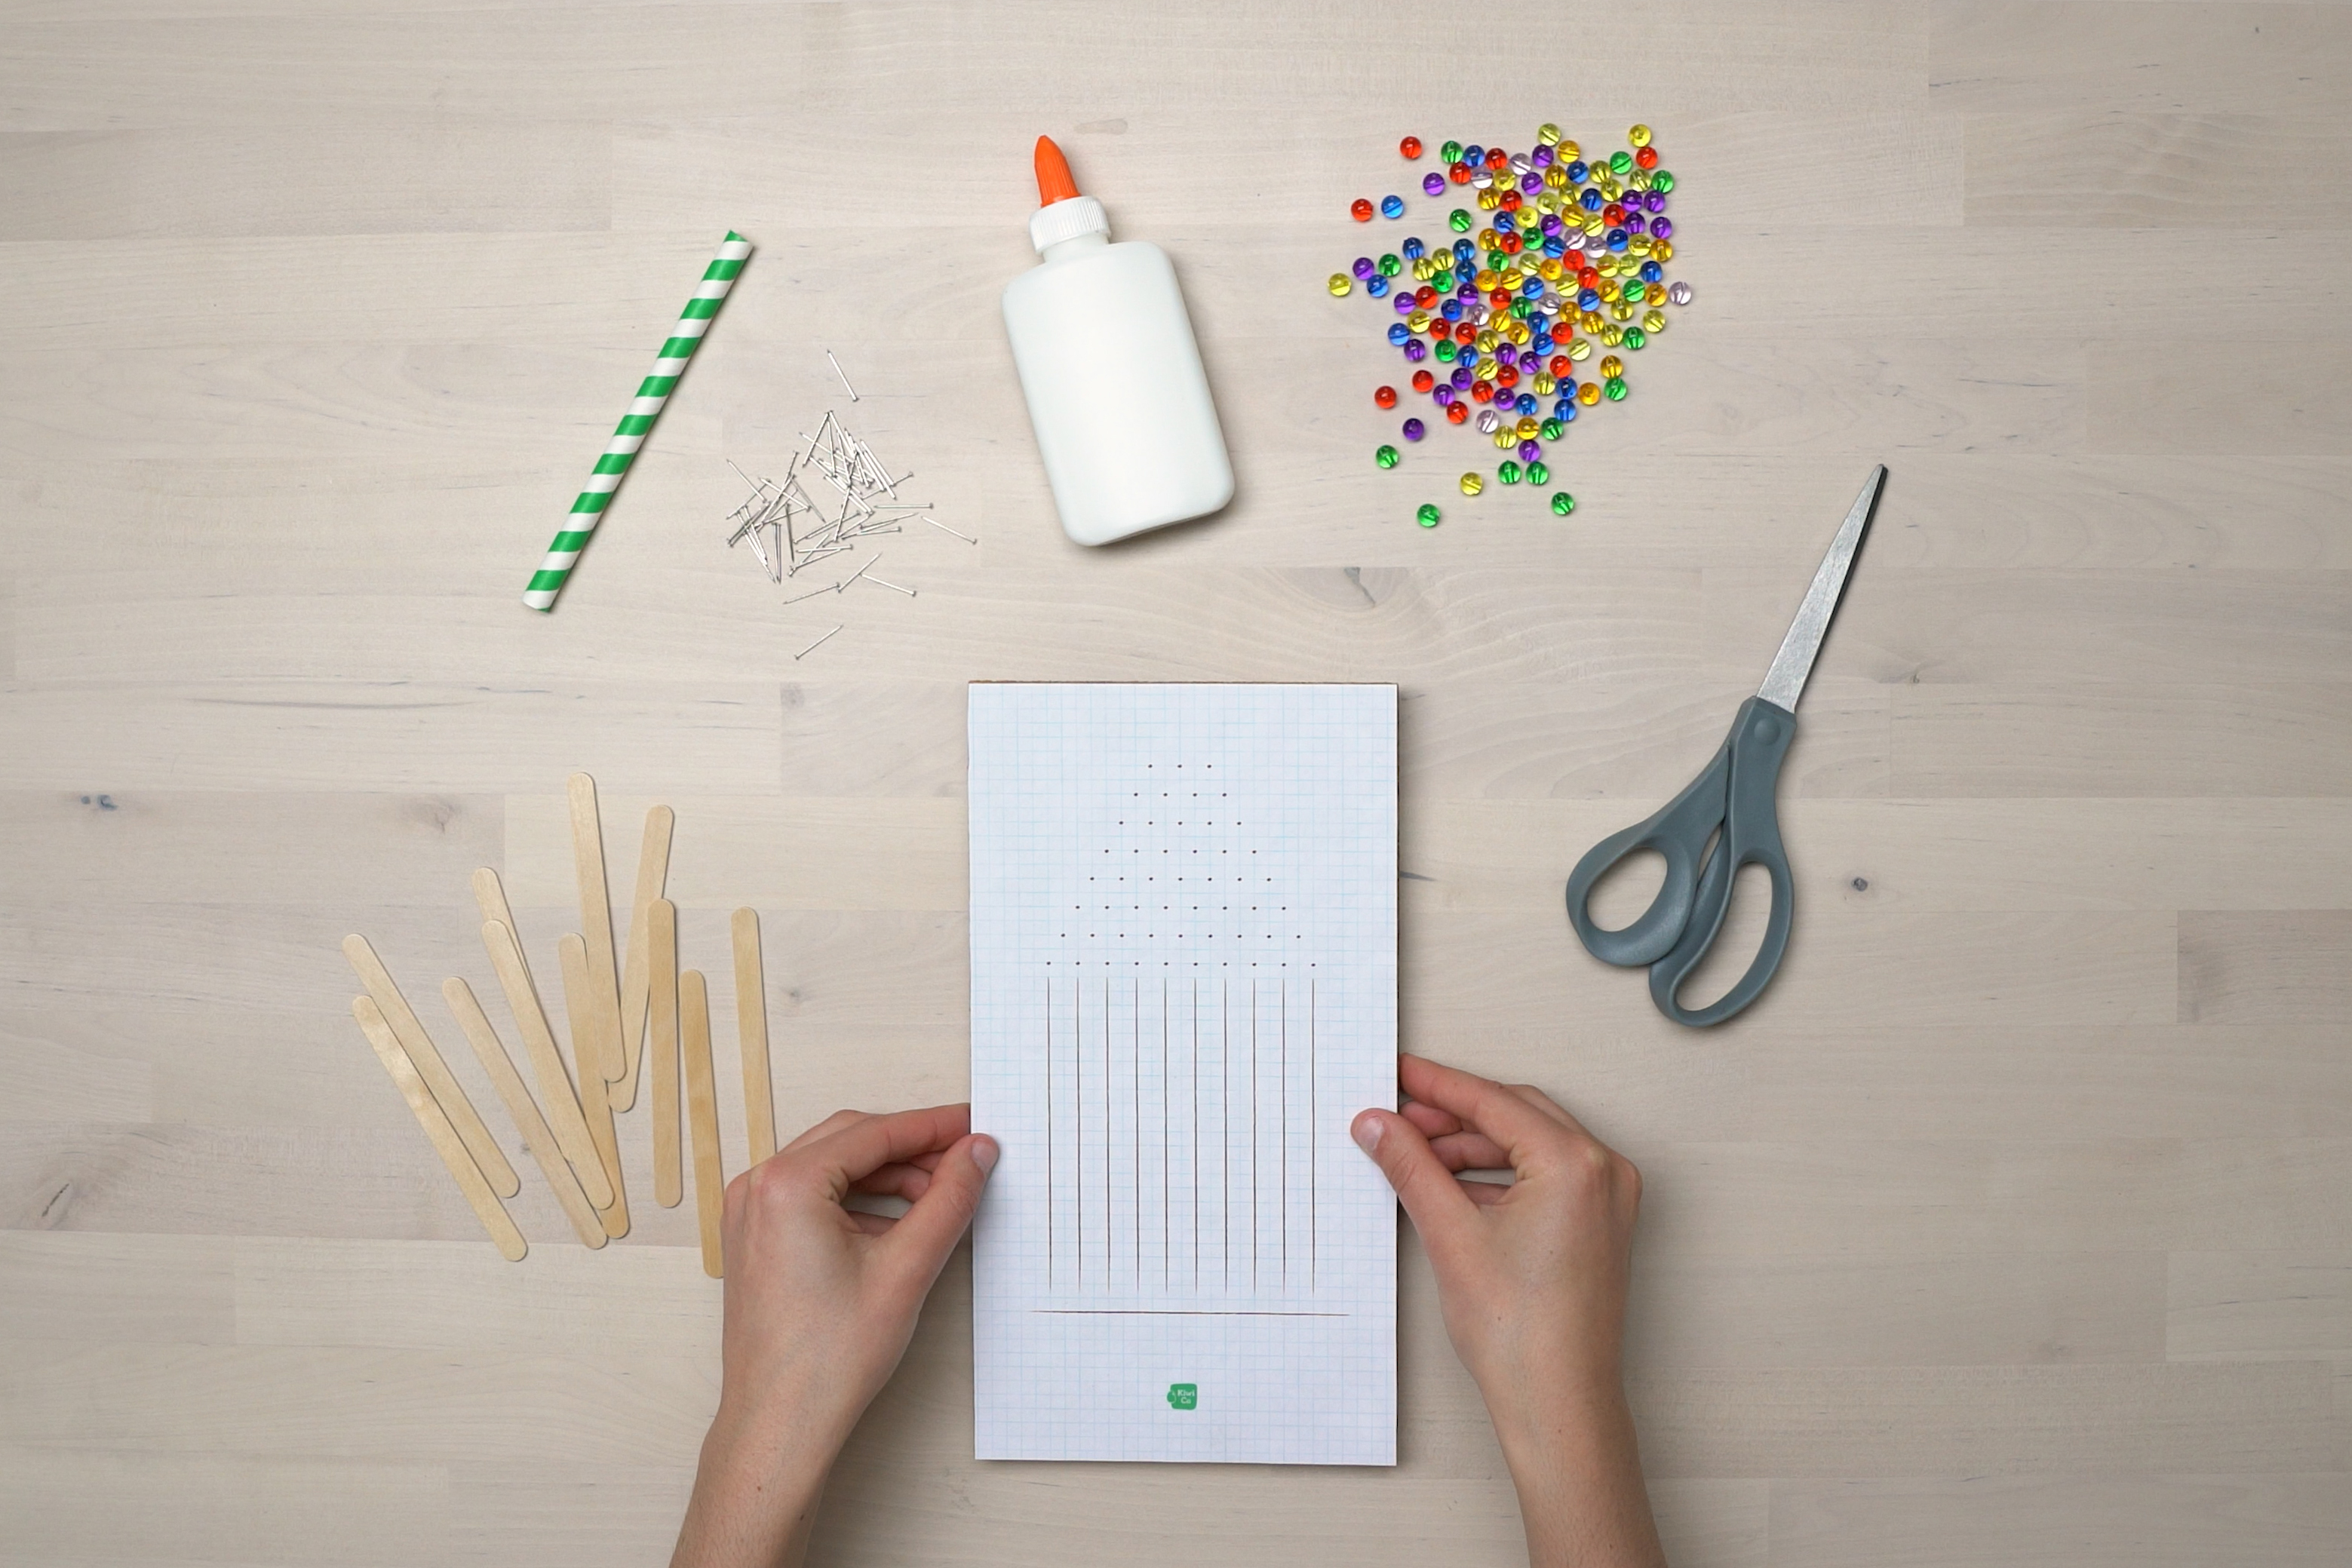
Step 2
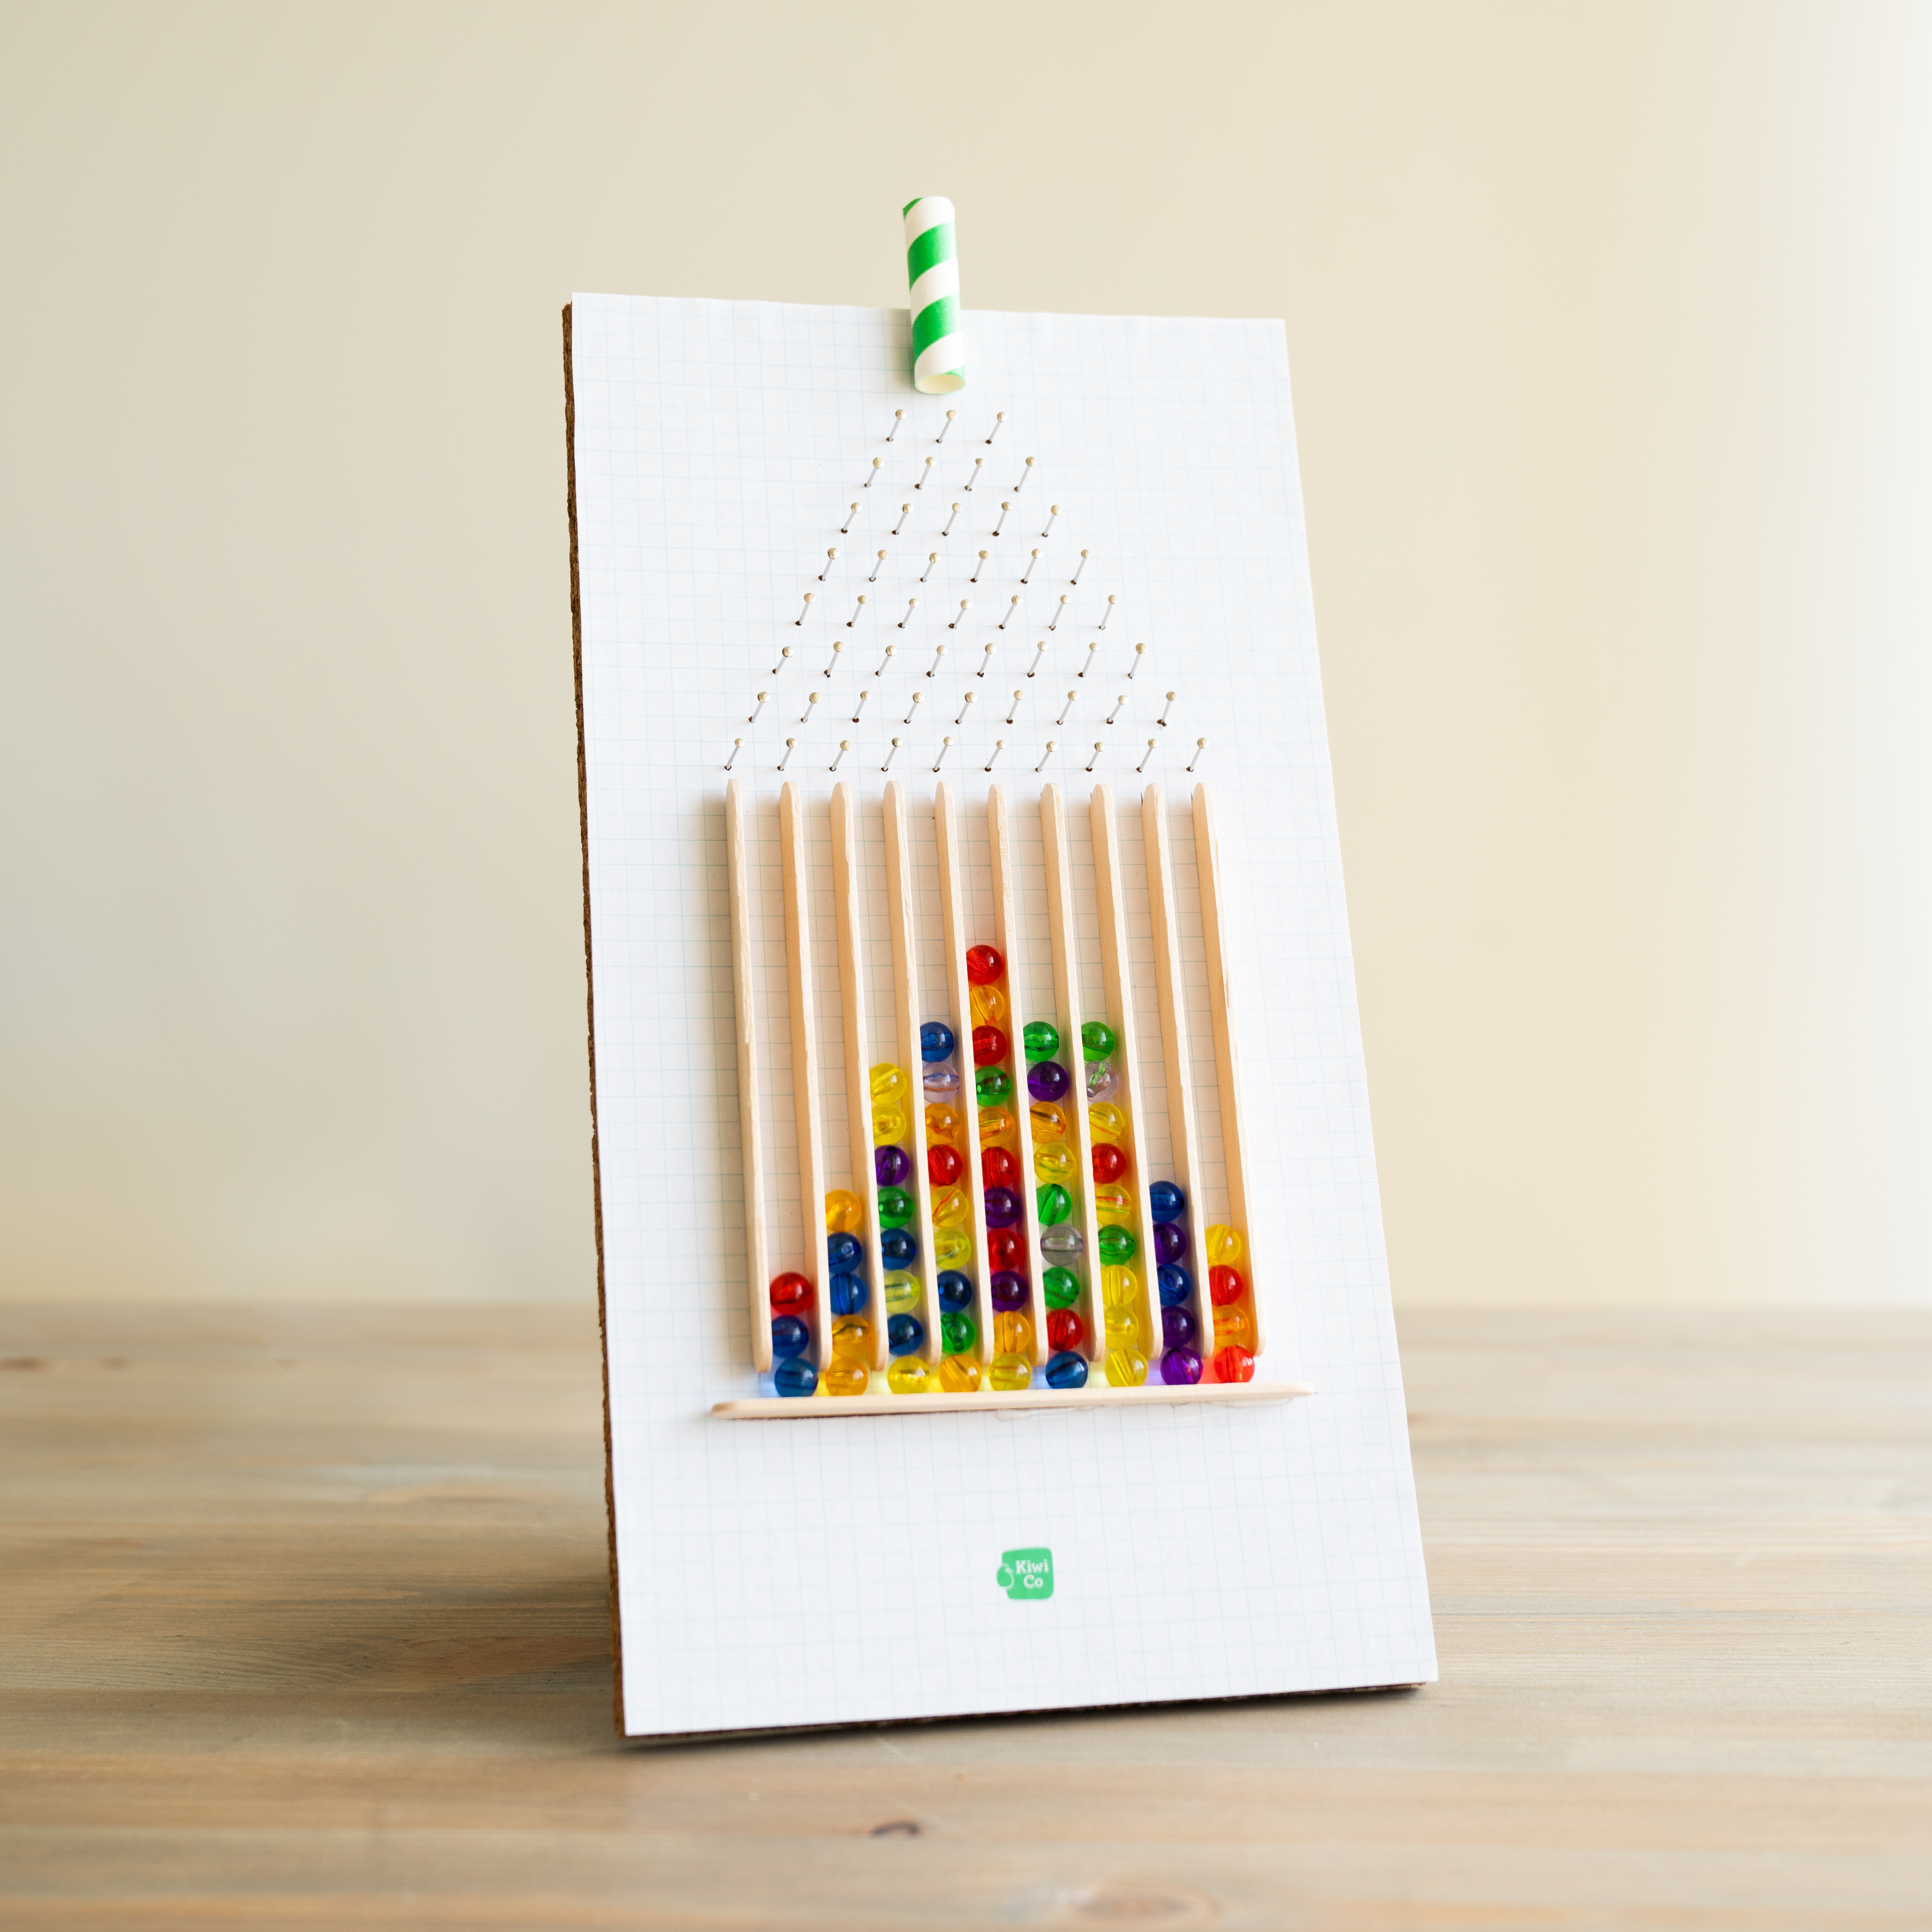
Glue the printable to one side of the corkboard. Then, trim the paper to the corkboard.
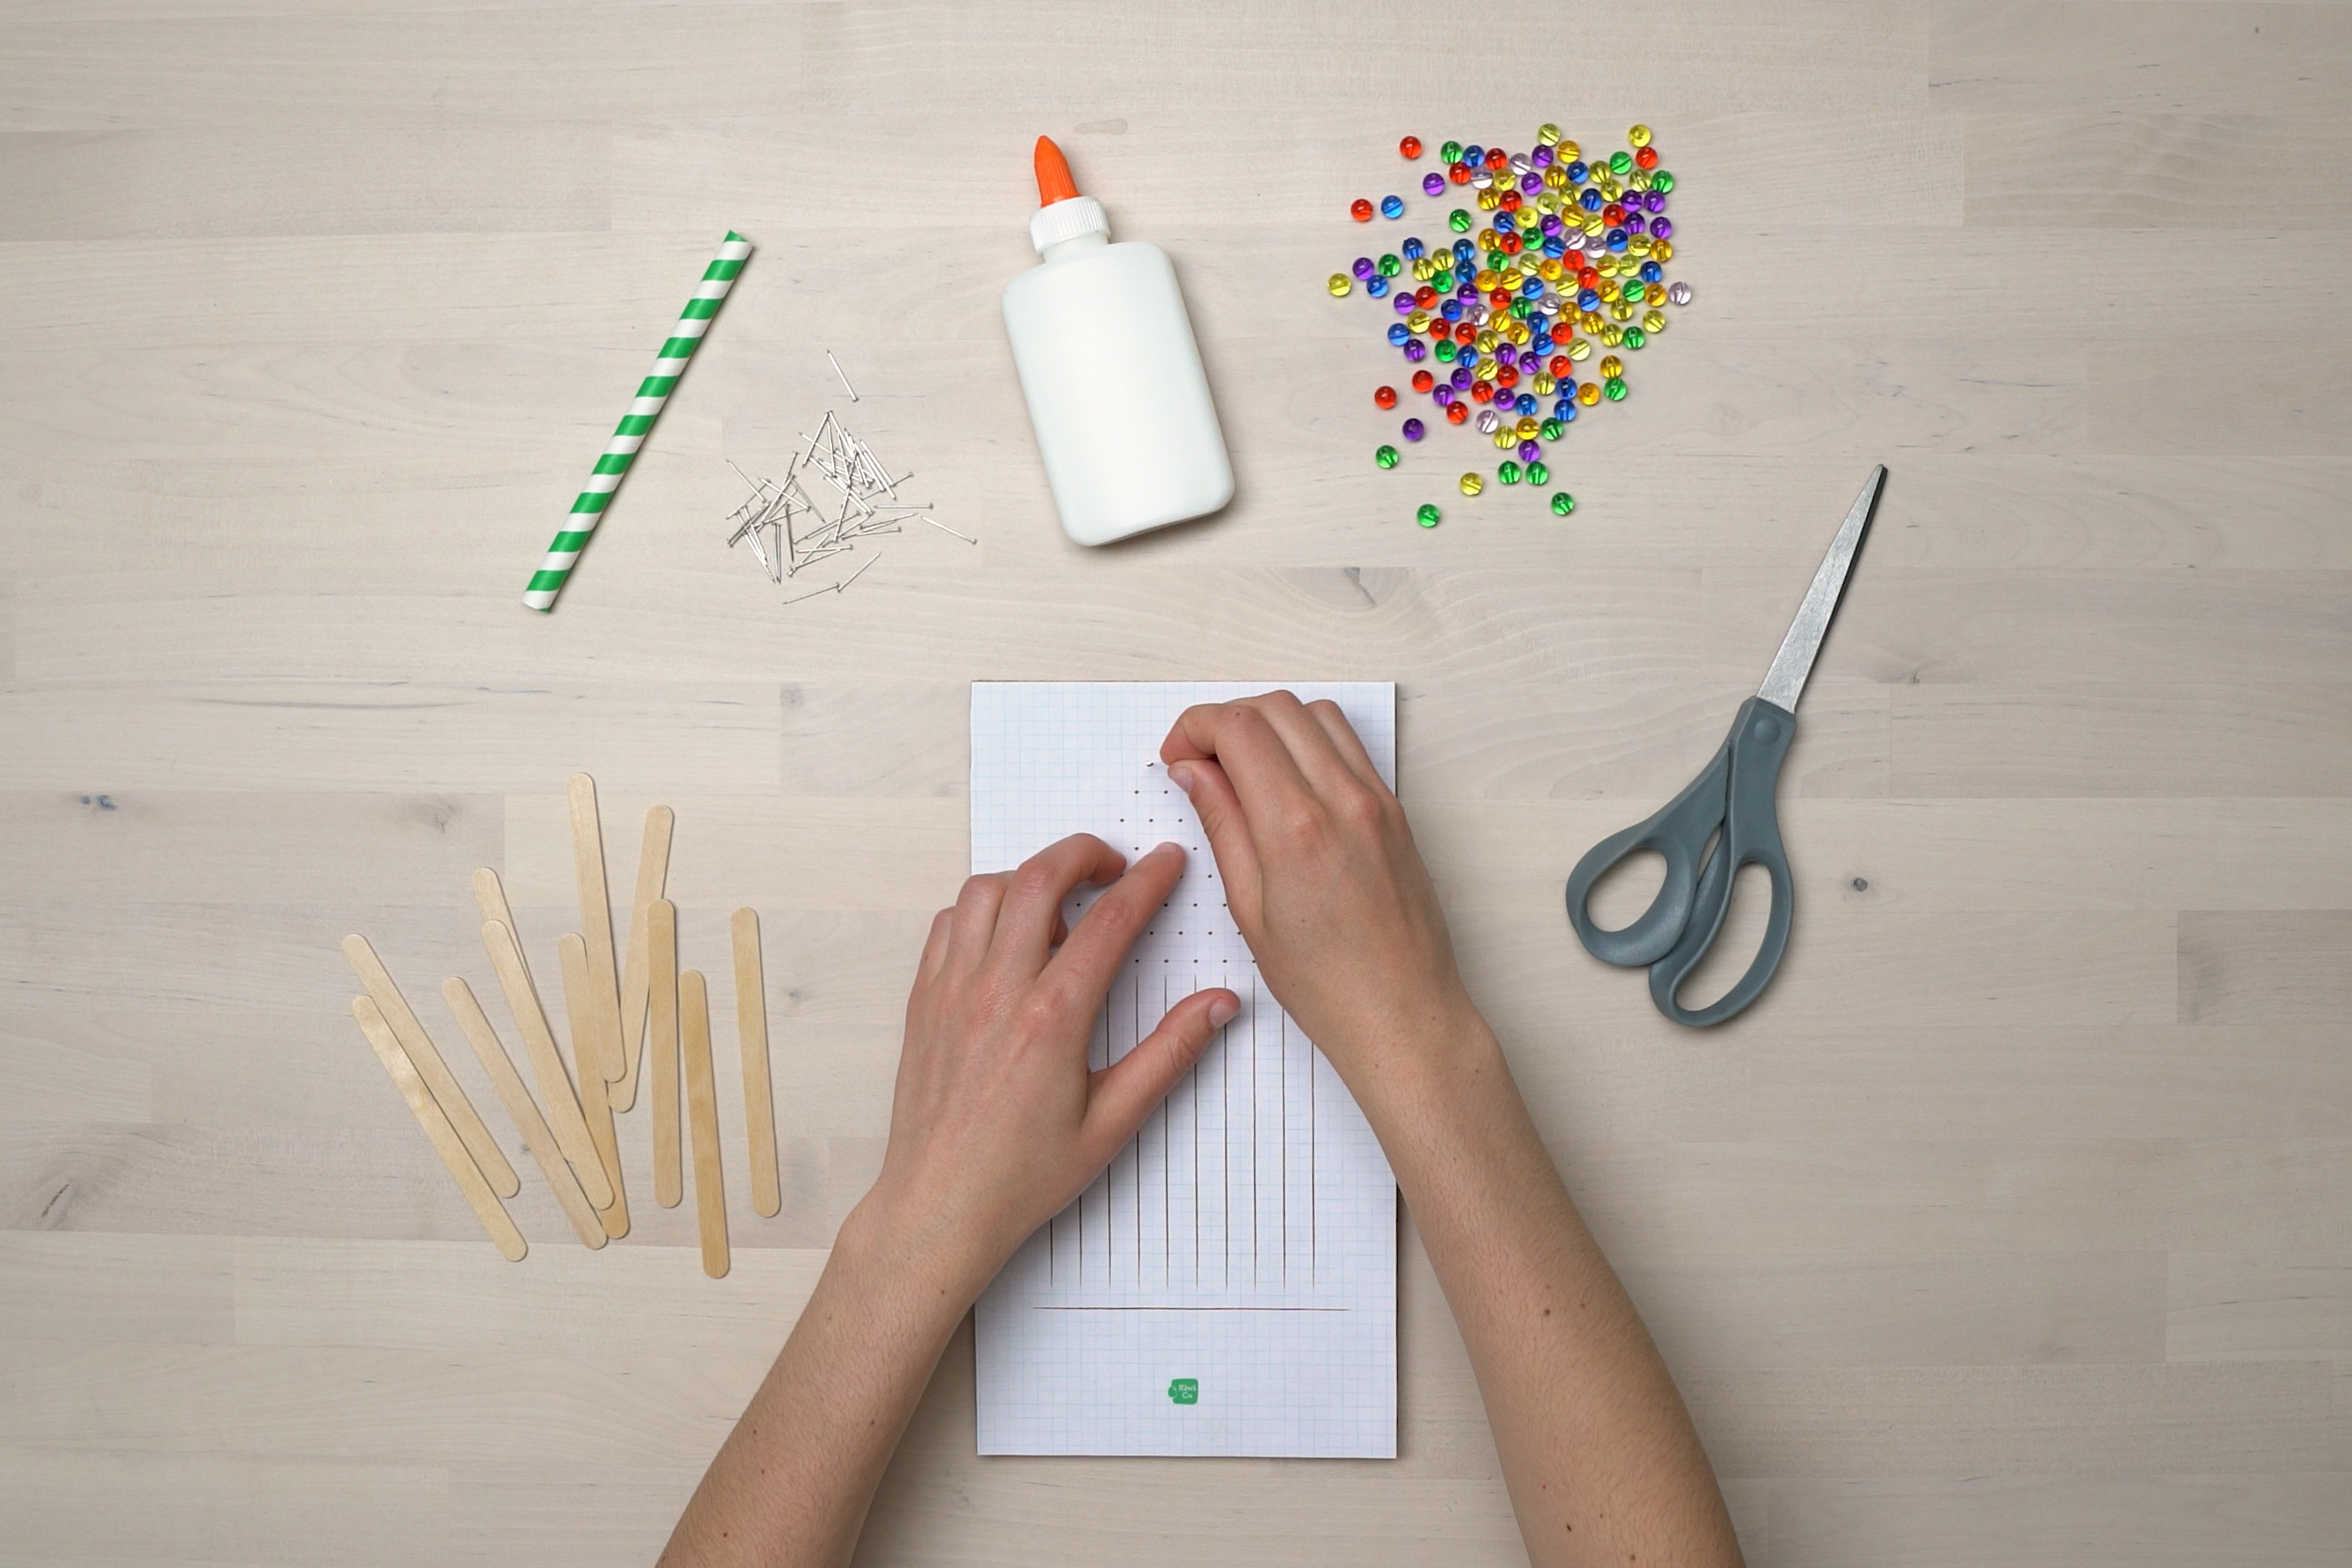
Step 3
Push a pin into every dot. You may need a grown-up to assist you.
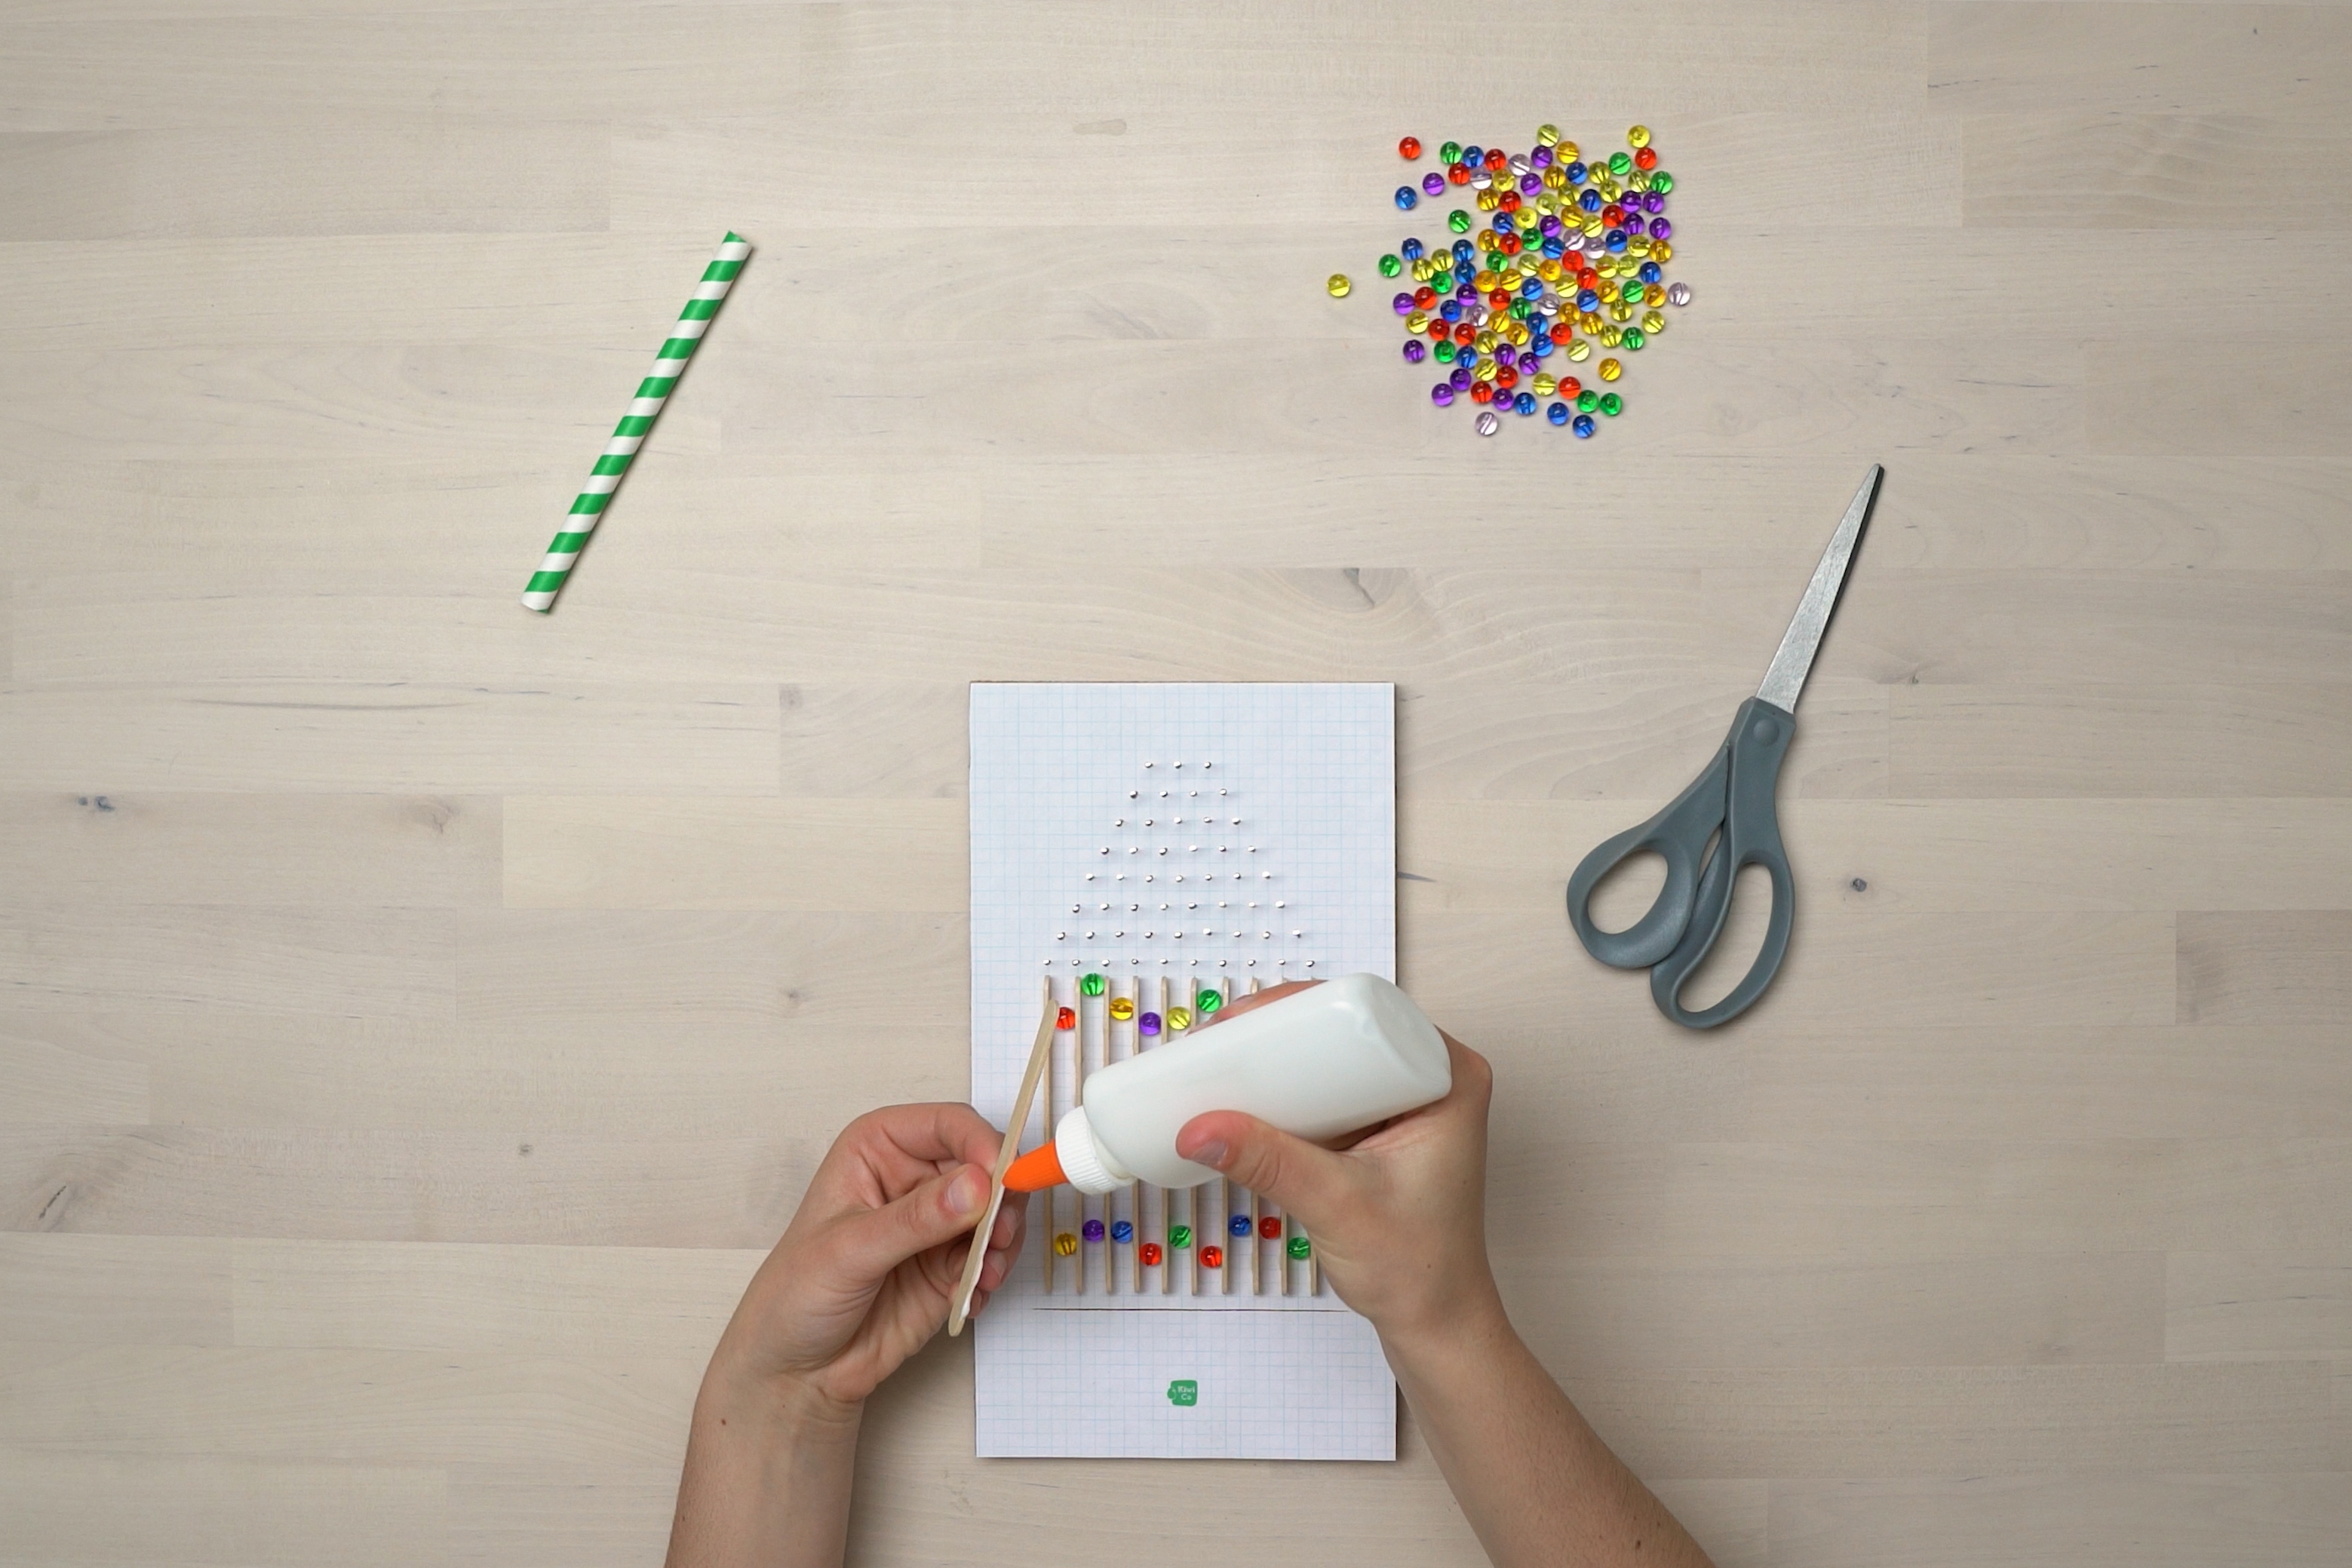
Step 4
Glue a popsicle stick on top of every line, using beads to help evenly space the popsicle sticks. Let them dry for at least ½ hour.
Step 5
Cut 2” of the straw and glue it along the top of the corkboard centered above the first row of pins.
Step 6
Lean the corkboard up against a wall and drop some beads down the straw. The more beads you drop, the better!
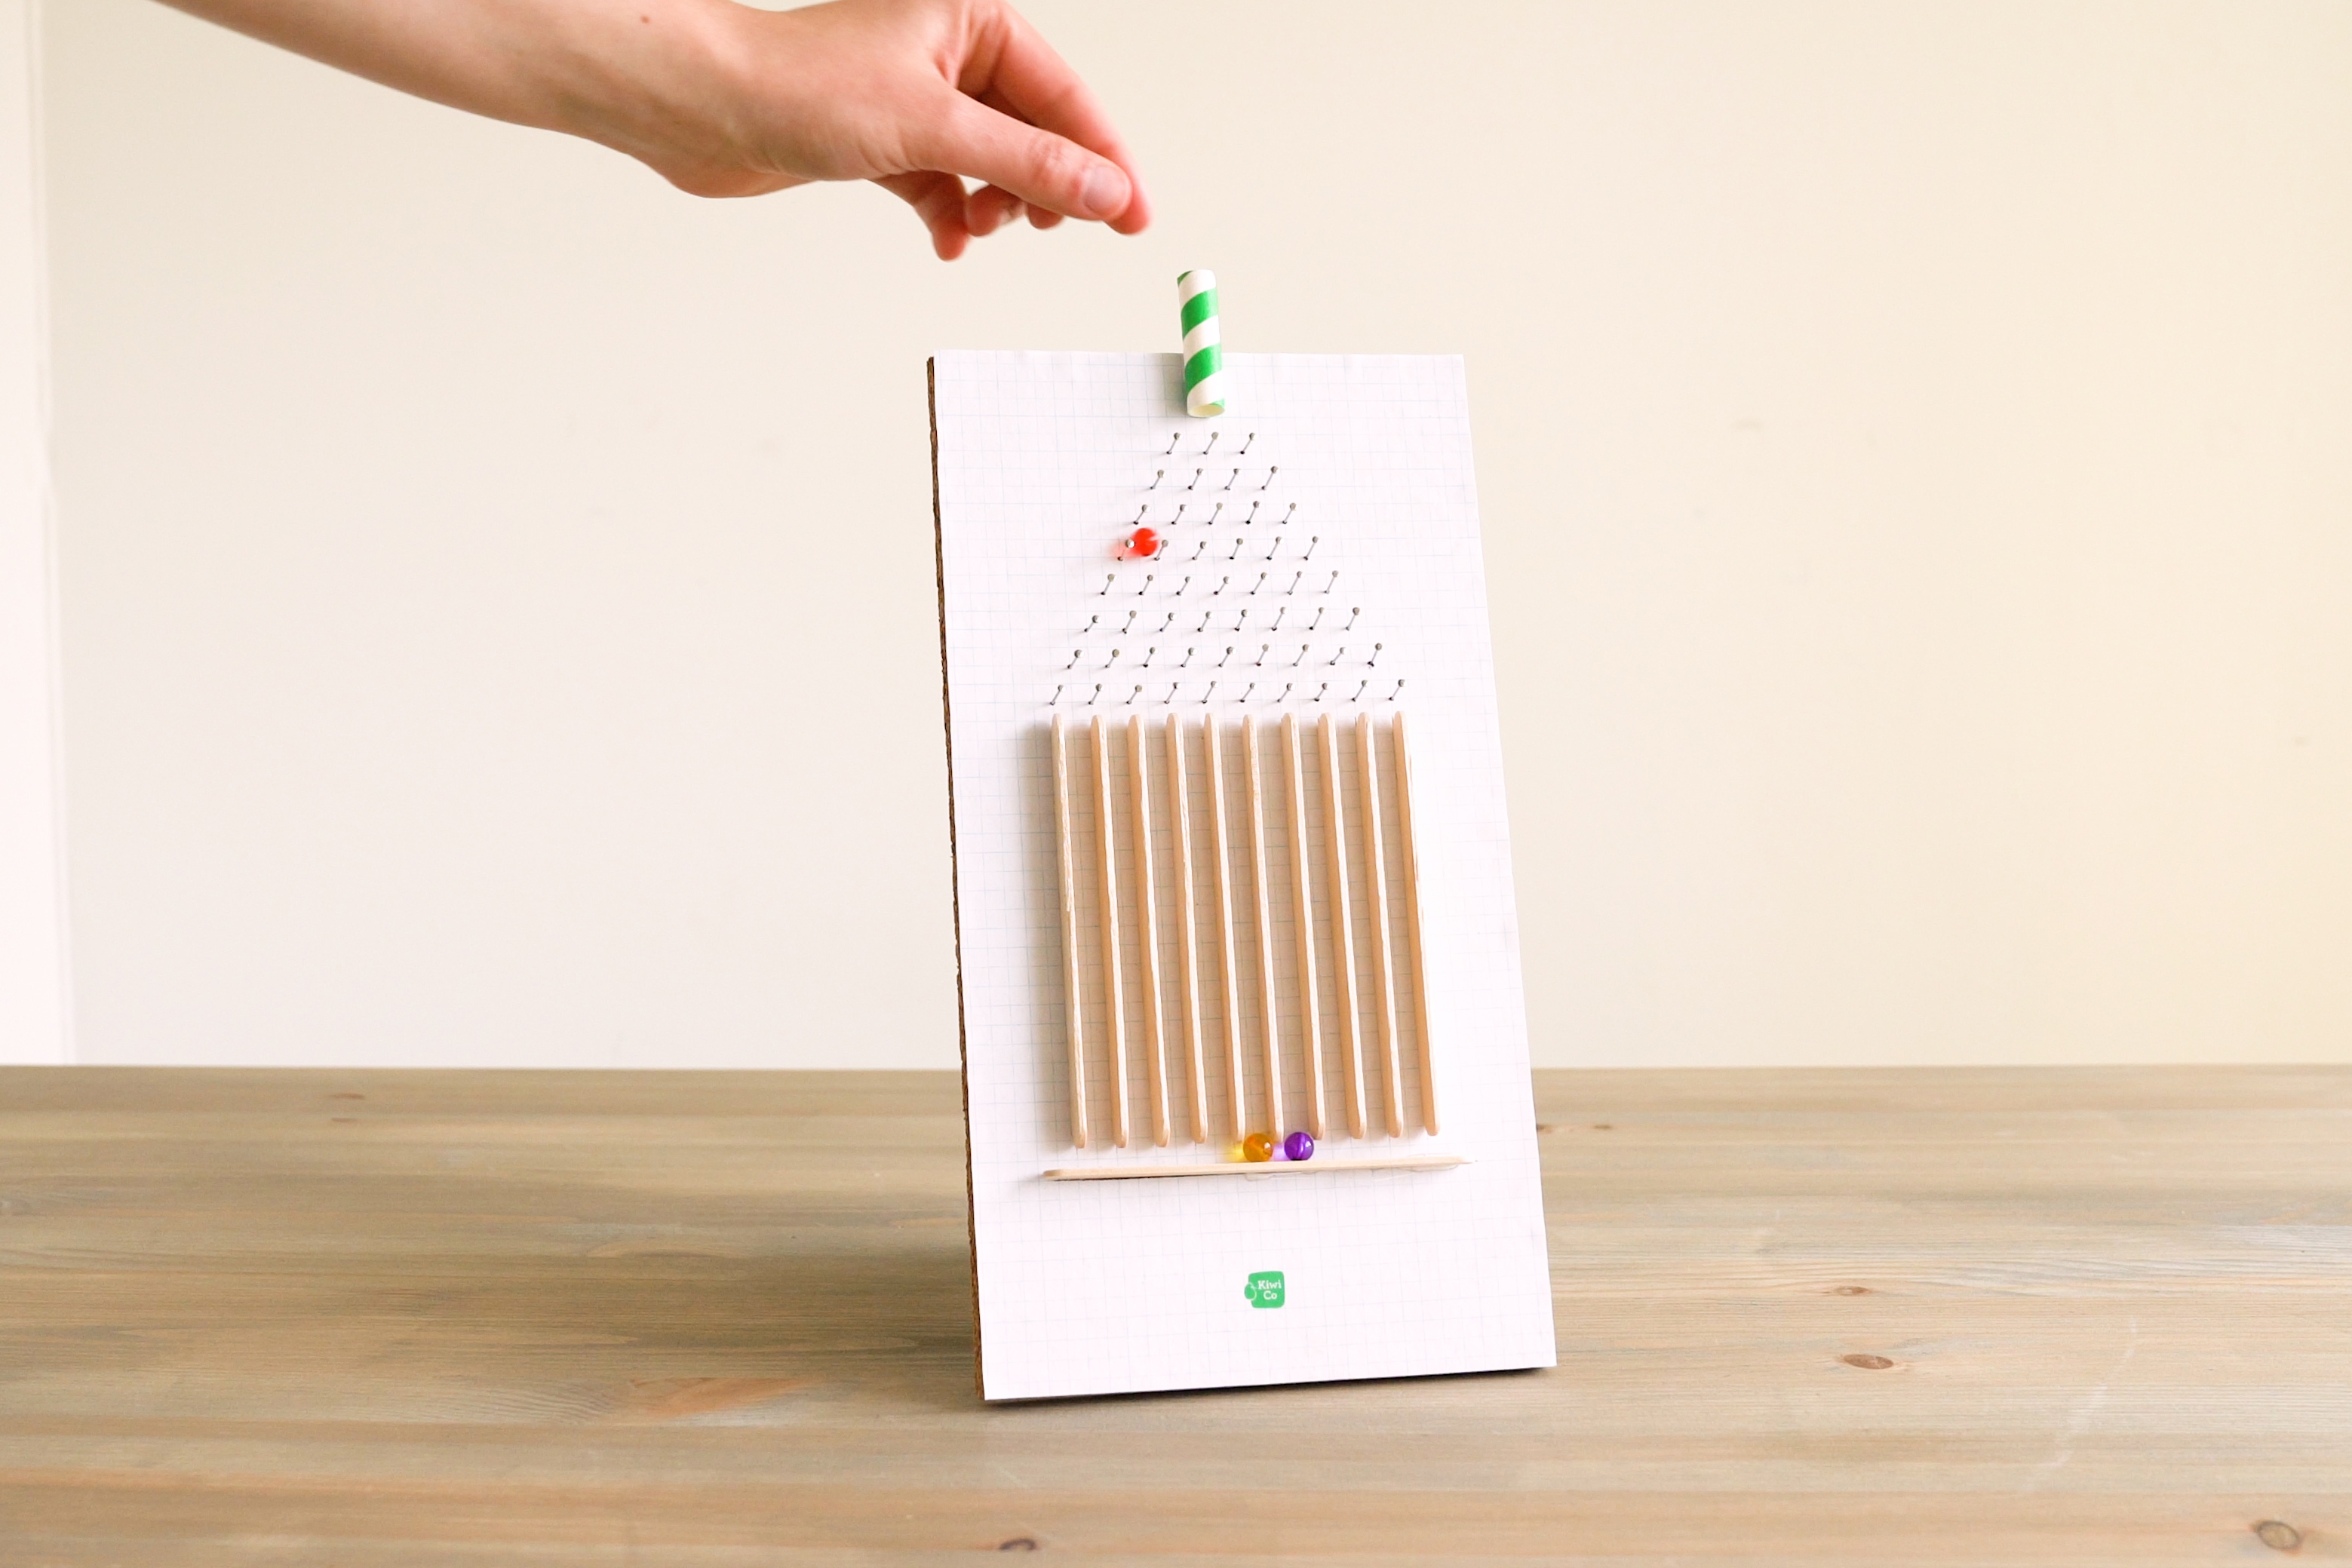
Fact

The board you just built is called a Galton Board. It’s named after a scientist who studied statistics, Sir Francis Galton, who was amazed by how something so seemingly random can create an orderly shape like the bell curve over and over again. Boards like this are now used in games of chance like pachinko and pinball.
Learn more
Imagine measuring a bunch of cat meows. Some meow annoyingly loud. Some meow adorably soft. But most meow at a volume somewhere in between those two extremes that we’d call “normal.”
For scientists who study statistics (a branch of science that collects a bunch of data and figures out the probability of, say, a cat meowing as loud as an airplane), they’d call this distribution of cat meows a normal distribution. On a scale of super quiet to super loud, there are a few at either extreme end of the scale, but most are somewhere in the middle.
If you graphed the amount of cats that meow at different volumes, you’d end up with a pretty interesting shape. It’d kind of look like a hill or a bell — tiny on both ends, but gradually sloping bigger and bigger toward the middle. Scientists who study statistics see this shape pop up every time they study something with normal distribution. They call it a bell curve, because it looks like a bell!
As you drop the beads down the board, the pins randomly knock them back and forth. However, there’s a greater likelihood for the beads to end up in the center of the board than out on the edges. That means — you guessed it — you get a “normal distribution” of beads. If you’ve dropped enough beads, you should start to see that shape that scientists who study statistics link with normal distribution: the bell curve.